Page 66 - sjsi
P. 66

Research Article: Tawashi & AlAmoudi                                                            66


            affects  one  component  or  more  of  the  three     can  explain  the  excess  dose  of  the  plasticizer
            mentioned. Table 3. below shows the increase          causes  additional  dispersion  and  scattering of
            in  the  cylindrical  compression  strength           the  cement  granules,  due  to  the  repulsion  of
            depending  on  the  cement  quantity,  the            the  negative  charges  that  enveloping  them.
            percentage of plasticizer, and W/C ratio. In the      Thus, there was a lack of bonding of the cement
            mixes with cement quantities 450 kg/m3, it is         granules. Another reason that could occur was
            noted that the compression strength takes the         an increase in the additional air to the mixture.
            same result with or without a plasticizer. This

                    Table 3. Compressive strength of SCC mixtures
                                 Cement
                    Mixture      quantity   W/C   Superplasticizer   Compression Strength   Strength Increase
                                                                           (MPa)
                                                        (%)
                                                                                               Ratio (%)
                                      3
                                 (kg/m )
                     RS-550        550     0.448         -                 33,572                  -
                 SCC-HRW-550       550     0.39          2                 37.616                 12
                     RS-500        500     0.448         -                 27.717                  -
                 SCC-HRW-500       500     0.39         2.5                28.249                 1.9
                     RS-450        450     0.448         -                 24.680                  -
                 SCC-HRW-450       450     0.39         2.5                24.890                0.01

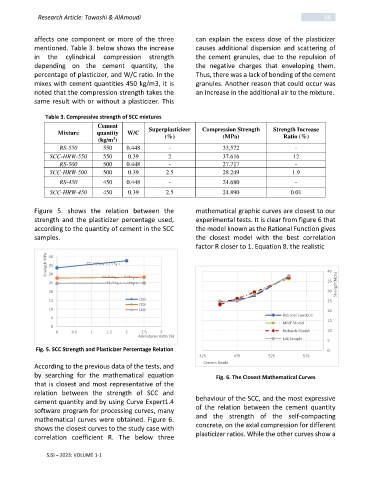
            Figure  5.  shows  the  relation  between  the        mathematical graphic curves are closest to our
            strength  and  the  plasticizer  percentage  used,    experimental tests. It is clear from figure 6 that
            according to the quantity of cement in the SCC        the model known as the Rational Function gives
            samples.                                              the  closest  model  with  the  best  correlation
                                                                  factor R closer to 1. Equation 8, the realistic

                Strength MPa  40  33.572 x +  2.022 y =                                                      40
                 35
                 30
                                   27.717 x +  0.2128 y =
                 25                 24.68 x +  0.084 y =                                                     35 Strength(Mpa)
                 20                                                                                          30
                 15                            C550                                                          25
                                               C500
                 10                            C450                                                          20
                                                                                               Rational Function
                  5
                                                                                                             15
                                                                                               MMF Model
                  0
                    0    0.5   1    1.5    2    2.5   3                                        Richards Model  10
                                               Admixtures Ratio (%)
                                                                                               Lab Sample
                                                                                                             5
             Fig. 5. SCC Strength and Plasticizer Percentage Relation                                        0
                                                                   425        475         525        575
                                                                    Cement Grade
            According to the previous data of the tests, and
            by  searching  for  the  mathematical  equation               Fig. 6. The Closest Mathematical Curves
            that is closest and most representative of the

            relation  between  the  strength  of  SCC  and
                                                                  behaviour of the SCC, and the most expressive
            cement quantity and by using Curve Expert1.4
            software program for processing curves, many          of  the  relation  between  the  cement  quantity
                                                                  and  the  strength  of  the  self-compacting
            mathematical curves were obtained. Figure 6.
                                                                  concrete, on the axial compression for different
            shows the closest curves to the study case with
            correlation  coefficient  R.  The  below  three       plasticizer ratios. While the other curves show a

                      SJSI – 2023: VOLUME 1-1
   61   62   63   64   65   66   67   68   69   70   71