
Page 69 - sjsi
P. 69
Research Article: Tawashi & AlAmoudi 69
selected coordinates from the descending part. two phases for the ascending and descending
So, it is appropriate to distinguish between the parts of the curve. Table 4. below shows the
values of the constant b for each part of the values of the equation constant b according to
curve. Accordingly, this process was applied to the cement quantities and plasticizer
all experimental axial compression, in which percentage in the parts of the ascending and
different percentages of plasticizers were used descending curve. Throughout substituting the
(2%,2.5%) for different cement quantities experimental values and using the Curve Expert
(450,500,550 kg/m3). The values of constant b 1.4 program. In addition to the value of b in
can be obtained using the Curve Expert1.4 general for all cement grades and the plasticizer
curve processing program as well. Throughout percentage using the Curve Expert 1.4.
inserting the previous Equation 17. into the Table 4. Shows the values of the equation
program and then the experimental values in constant b.
Table 4. Shows the values of the equation constant b
Cement Plasticizer Experimental Values CE 1.4 Overall
Grade Ascending Descending Ascending Descending Ascending Descending
( kg/m 3 ) (%) Part Part Part Part Part Part
550 2 1.09 0.04 1.39 0.08
2.14 0.57
500 2.5 1.29 0.34 2.33 0.36
Therefore, the proposed general mathematical ϭ
1.2
formula could be expressed with the values of
constant b in the ascending and descending
parts of the curve. 1.0
Results 0.8
The Proposed General Mathematical Formulas
for the Stress-Strain Curve of SCC: 0.6
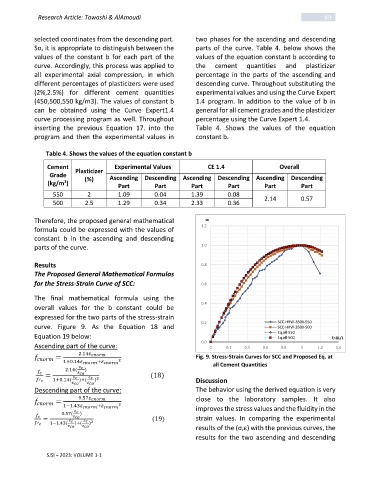
The final mathematical formula using the
0.4
overall values for the b constant could be
expressed for the two parts of the stress-strain
0.2 SCC-HRW-3500-550
curve. Figure 9. As the Equation 18 and SCC-HRW-3500-500
Eq.all-550
Equation 19 below: Eq.all-500 ξ=∆L/L
0.0
Ascending part of the curve: 0 0.2 0.4 0.6 0.8 1 1.2 1.4
= 2.14 Fig. 9. Stress-Strain Curves for SCC and Proposed Eq. at
1+0.14 + 2 all Cement Quantities
2.14( )
= (18)
)
′ 1+0.14( )+( 2 Discussion
Descending part of the curve: The behavior using the derived equation is very
= 0.57 close to the laboratory samples. It also
1−1.43 + 2 improves the stress values and the fluidity in the
0.57( )
= (19) strain values. In comparing the experimental
)
′ 1−1.43( )+( 2
results of the (σ,ε) with the previous curves, the
results for the two ascending and descending
SJSI – 2023: VOLUME 1-1